|
Delaware
|
98-0204758
|
|
(State
or other jurisdiction of incorporation or organization)
|
(IRS
Employer Identification No.)
|
|
Title
of each class
|
Name
of each exchange on which
registered
|
|
Common
Stock, $0.0001 par value
|
The
NASDAQ Stock Market LLC
(NASDAQ
Global Market)
|
|
|
|
|
|
PAGE
|
|
|
PART
I
|
|
||||
|
|
|
|
|
||
|
Item
1.
|
|
Business
|
|
4
|
|
|
Item
1A.
|
|
Risk
Factors
|
|
9
|
|
|
Item
2.
|
|
Properties
|
|
14
|
|
|
Item
3.
|
|
Legal
Proceedings
|
|
14
|
|
|
Item
4.
|
|
Submission
of Matters to a Vote of Security Holders
|
|
14
|
|
|
|
|
|
|
|
|
|
PART
II
|
|
||||
|
|
|
|
|
||
|
Item
5.
|
|
Market
for Registrant’s Common Equity, Related Stockholder Matters and Issuer
Purchases of
Equity Securities
|
|
15
|
|
|
Item
6.
|
|
Selected
Financial Data
|
|
17
|
|
|
Item
7.
|
|
Management’s
Discussion and Analysis of Financial Condition and Results of
Operations
|
|
18
|
|
|
Item
7A.
|
|
Quantitative
and Qualitative Disclosures about Market Risk
|
|
29
|
|
|
Item
8.
|
|
Financial
Statements and Supplementary Data
|
|
F-1-F-31
|
|
|
Item
9.
|
|
Changes
in and Disagreements with Accountants on Accounting and Financial
Disclosures
|
|
30
|
|
|
Item
9A.
|
|
Controls
and Procedures
|
|
30
|
|
|
Item
9B.
|
|
Other
Information
|
|
30
|
|
|
|
|
|
|
|
|
|
PART
III
|
|
||||
|
|
|
|
|
||
|
Item
10.
|
|
Directors,
Executive Officers and Corporate Governance
|
|
31
|
|
|
Item
11.
|
|
Executive
Compensation
|
|
34
|
|
|
Item
12.
|
|
Security
Ownership of Certain Beneficial Owners and Management and Related
Stockholder Matters
|
|
39
|
|
|
Item
13.
|
|
Certain
Relationships and Related Transactions, and Director
Independence
|
|
41
|
|
|
Item
14.
|
|
Principal
Accountant Fees and Services
|
|
41
|
|
|
|
|
|
|
|
|
|
PART
IV
|
|
||||
|
|
|
|
|
||
|
Item
15.
|
|
Exhibits
and Financial Statement Schedules
|
|
42
|
|
|
|
|
|
|
|
|
|
|
|
Signatures
|
|
47
|
|
|
•
|
Mobility.
Mobile
communications and computing are among the driving forces behind
the
demand for wireless connectivity. The increased functionality and
declining cost of mobile wireless devices has fueled further growth.
Mobile connectivity has led to greater productivity as organizations
transmit data and gather information from remote staff and locations
where
land line connectivity is unavailable. Such mobile connectivity has
created significant cost savings in data collection, increased
responsiveness, enabled greater access to enterprise resources and
improved controls.
|
|
•
|
Capacity.
Current
technology allows wireless transmission with capacity, quality and
reliability superior to land line and comparable to fiber. For example,
current radio technology is capable of two-way data transfer at rates
up
to 1 gigabits per second, allowing wireless networks to transmit
content
as quickly as over fiber in most
instances.
|
|
•
|
Cost.
Wireless
networks cost less than comparable landline networks both to deploy
and to
operate. Wireless deployment is less expensive because the installation
of
a landline network is more labor-intensive, requires more time and
may
involve substantial right-of-way expenditures. We expect the main
cost
component of wireless networks, equipment, to continue to decline
as
technology advances and production volumes increase. Operating costs
of
wireless networks are also lower because landlines require extensive
troubleshooting to execute repairs. In addition, wireless networks
bypass
local service providers, eliminating recurring monthly
charges.
|
|
•
|
Deployment.
Because
enterprise wireless networks do not require negotiating rights of
way,
substantial infrastructure engineering, time-consuming third party
coordination efforts or additional FCC licensing, they can be deployed
quickly and less expensively. Rapid deployment allows organizations
to
install networks more closely in line with immediate needs rather
than
having to commit to time-consuming engineering projects in anticipation
of
future growth.
|
|
•
|
Increased
security of wireless data
transmission;
|
|
•
|
Introduction
of new technologies;
|
|
•
|
Increasing
accessibility and affordability of wireless mobile devices;
and
|
|
•
|
Increased
capacity of wireless networks, making them a legitimate substitute
for
land line communications.
|
| • | Provide additional services for our customers. Each acquisition we make expands our customer base. We seek to expand these new customer relationships by making them aware of the diverse products and services we offer. We believe that providing these customers the full range of our services will lead to new projects or revenue opportunities and increased profitability. |
|
•
|
Maintain
and expand our focus in vertical markets. We
have deployed successful, innovative wireless solutions for multiple
customers in a number of vertical markets, such as public safety,
healthcare, security and gaming. We will continue to seek additional
customers in these targeted vertical markets who can benefit from
our
expertise and look for new ways in which we can deploy wireless networks
to enhance productivity within these markets. We also look to expand
our
vertical market coverage and include these new markets as
appropriate.
|
|
•
|
Strengthen
our relationships with technology providers. We
will continue to strengthen the relationships we have with technology
providers. These companies rely on us to deploy their technology
products
within their customer base. We have worked with these providers in
testing
new equipment they develop and our personnel maintain certifications
on
our technology providers’ products. We also look for innovative products
that can be of benefit to our customers, and endeavor to establish
similar
relationships with new technology providers as part of our commitment
to
offering the most advanced
solutions.
|
|
•
|
Seek
strategic acquisitions.
We will continue to look for additional acquisitions of compatible
businesses that can be assimilated into our organization, expand
our
geographic coverage and add accretive earnings to our business. Our
preferred acquisition candidates will have experience with specialty
communication systems. Since April 30, 2007, we have signed letters
of
intent to acquire Major Electric, Inc. and Max Engineering LLC. We
expect
these acquisitions to close by August 1, 2007, subject to completion
of
due diligence and the execution of definitive agreements.
|
|
•
|
Asset
tracking, which is a wireless network that monitors the location
of mobile
assets such as vehicles or stationary assets such as
equipment;
|
|
•
|
Telematics,
which are instructions sent through a wireless network that controls
a
device such as a slot machine or traffic signal;
and
|
|
•
|
Telemetry,
which is the acquisition of data from a measuring device, such as
devices
used at a water treatment plant to maintain the integrity of drinking
water.
|
|
•
|
Installation,
testing and commissioning of base station equipment, which is the
installation of radio frequency equipment inside the shelter at a
cell
site, and testing to ensure that the equipment is operating prior
to cell
site activation;
|
|
•
|
Equipment
modification and reconfiguration, which involves replacing old equipment
with new equipment, re-routing cables, and re-locating equipment
at the
cell site;
|
|
•
|
Network
modifications, which refers to work done on existing cell sites to
increase capacity or change the direction of sectors or
antennas;
|
|
•
|
Sectorization,
which is the installation of antennas to existing cell towers to
increase
the capacity of the cell site; and
|
|
•
|
Maintenance,
which includes antenna maintenance to replace damaged antennas, installing
tower lighting control panels or sensors, or repairing damaged
shelters.
|
|
•
|
the
timing and size of network deployments and technology upgrades by
our
customers;
|
|
•
|
fluctuations
in demand for outsourced network
services;
|
|
•
|
the
ability of certain customers to sustain capital resources to pay
their
trade accounts receivable balances and required changes to our allowance
for doubtful accounts based on periodic assessments of the collectibility
of our accounts receivable
balances;
|
|
•
|
reductions
in the prices of services offered by our
competitors;
|
|
•
|
our
success in bidding on and winning new business;
and
|
|
•
|
our
sales, marketing and administrative cost
structure.
|
|
•
|
quarterly
variations in operating results;
|
|
•
|
announcements
of new services by us or our
competitors;
|
|
•
|
the
gain or loss of significant
customers;
|
|
•
|
changes
in analysts’ earnings estimates;
|
|
•
|
rumors
or dissemination of false
information;
|
|
•
|
pricing
pressures;
|
|
•
|
short
selling of our common stock;
|
|
•
|
impact
of litigation;
|
|
•
|
general
conditions in the market;
|
|
•
|
changing
the exchange or quotation system on which we list our common stock
for
trading;
|
|
•
|
political
and/or military events associated with current worldwide conflicts;
and
|
|
•
|
events
affecting other companies that investors deem comparable to
us.
|
|
|
·
|
changes
in the region’s economic, social and political conditions or government
policies;
|
|
|
·
|
changes
in trade laws, tariffs and other trade restrictions or
licenses;
|
|
|
·
|
changes
in foreign exchange regulation in China may limit our ability to
freely
convert currency to make dividends or other payments in U.S.
dollars;
|
|
|
·
|
fluctuation
in the value of the RMB ( Chinese Yuan) could adversely affect the
value
of our investment in China;
|
|
|
·
|
limitations
on the repatriation of earnings or assets, including
cash;
|
|
|
·
|
adverse
changes in tax laws and
regulations;
|
|
|
·
|
difficulties
in managing or overseeing our China operations, including the need
to
implement appropriate systems, policies, benefits and compliance
programs;
and
|
|
|
·
|
different
liability standards and less developed legal systems that may be
less
predictable than those in the United
States.
|
|
|
Minimum
|
||
|
|
Lease
|
Annual
|
|
|
Location
|
Subsidiary
|
Expiration
Date
|
Rent
|
|
Exton,
Pennsylvania
|
WPCS
Corporate headquarters
|
February
1, 2008
|
$51,000
|
|
Auburn,
California (1)
|
Clayborn
|
Month-to-month
|
$64,440
|
|
St.
Louis, Missouri
|
Heinz
|
August
31, 2010
|
$56,142
|
|
Exton,
Pennsylvania
|
Heinz
|
July
31, 2008
|
$8,640
|
|
Windsor,
Connecticut
|
NECS
|
April
30, 2014
|
$80,821
|
|
Chicopee,
Massachusetts
|
NECS
|
August
31, 2007
|
$3,000
|
|
Lakewood,
New Jersey
|
Quality
|
August
31, 2007
|
$118,370
|
|
Sarasota,
Florida (2)
|
SECS
|
July
31, 2011
|
$51,360
|
|
Trenton,
New Jersey (3)
|
Voacolo
|
April
1, 2008
|
$54,000
|
|
Fairfield,
California (4)
|
Walker
Comm
|
February
28, 2011
|
$96,950
|
|
Rocklin,
California
|
Walker
Comm
|
January
31, 2008
|
$27,300
|
|
San
Leandro, California
|
Walker
Comm
|
July
31, 2008
|
$13,824
|
|
Period
|
High
|
Low
|
|||||
|
Fiscal
Year Ended April 30, 2007:
|
|||||||
|
First
Quarter
|
$
|
9.80
|
$
|
6.53
|
|||
|
Second
Quarter
|
10.75
|
6.60
|
|||||
|
Third
Quarter
|
10.58
|
8.64
|
|||||
|
Fourth
Quarter
|
13.74
|
9.30
|
|||||
|
Fiscal
Year Ending April 30, 2006:
|
|||||||
|
First
Quarter
|
$
|
9.18
|
$
|
4.32
|
|||
|
Second
Quarter
|
9.03
|
5.58
|
|||||
|
Third
Quarter
|
12.78
|
6.12
|
|||||
|
Fourth
Quarter
|
12.45
|
7.20
|
|||||
|
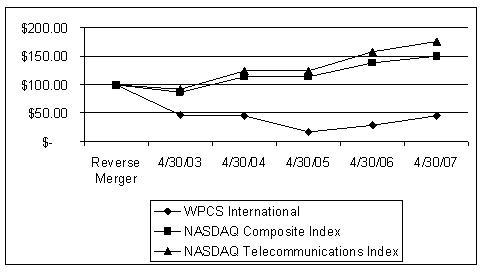
Reverse
Merger
|
4/30/03
|
4/30/04
|
4/30/05
|
4/30/06
|
4/30/07
|
|
|
WPCS
International
|
$
100.00
|
$
46.00
|
$
45.60
|
$
16.50
|
$
28.10
|
$
44.83
|
|
NASDAQ
Composite Index
|
$
100.00
|
$
86.74
|
$
113.74
|
$
113.83
|
$
137.57
|
$
149.57
|
|
NASDAQ
Telecommunications Index
|
$
100.00
|
$
91.94
|
$
124.49
|
$
124.29
|
$
157.46
|
$
175.28
|
|
2007
|
2006
|
2005
|
2004
|
2003
|
||||||||||||
|
REVENUE
|
$
|
70,000,070
|
$
|
52,144,575
|
$
|
40,148,233
|
$
|
22,076,246
|
$
|
5,422,858
|
||||||
|
COSTS
AND EXPENSES:
|
||||||||||||||||
|
Cost
of revenue
|
47,781,351
|
38,010,945
|
32,445,470
|
17,286,099
|
3,768,495
|
|||||||||||
|
Selling,
general and administrative expenses
|
13,244,909
|
9,191,392
|
7,032,504
|
4,441,776
|
1,892,609
|
|||||||||||
|
Depreciation
and amortization
|
1,239,486
|
837,789
|
682,397
|
382,510
|
116,501
|
|||||||||||
|
Total
costs and expenses
|
62,265,746
|
48,040,126
|
40,160,371
|
22,110,385
|
5,777,605
|
|||||||||||
|
OPERATING
INCOME (LOSS)
|
7,734,324
|
4,104,449
|
(12,138
|
) |
(34,139
|
) |
(354,747
|
) | ||||||||
|
OTHER
EXPENSE (INCOME):
|
||||||||||||||||
|
Interest
expense
|
496,330
|
256,022
|
31,865
|
14,048
|
6,997
|
|||||||||||
|
Interest
income
|
(525,524
|
) |
(121,720
|
) |
(10,817
|
) | - | - | ||||||||
|
Minority
interest
|
23,099
|
-
|
- | - | - | |||||||||||
|
Loss
(gain) on change in fair value of warrants
|
-
|
4,078,494
|
(1,414,263
|
) | - | - | ||||||||||
|
INCOME
(LOSS) BEFORE INCOME TAX PROVISION
|
7,740,419
|
(108,347
|
) |
1,381,077
|
(48,187
|
) |
(361,744
|
) | ||||||||
|
Income
tax provision
|
3,146,818
|
1,515,773
|
52,096
|
76,000
|
19,550
|
|||||||||||
|
NET
INCOME (LOSS)
|
$
|
4,593,601
|
($1,624,120
|
)
|
$
|
1,328,981
|
($124,187
|
)
|
($381,294
|
)
|
||||||
|
Basic
net income (loss) per common share
|
$
|
0.80
|
($0.40
|
)
|
$
|
0.50
|
($0.01
|
)
|
($0.05
|
)
|
||||||
|
Diluted
net income (loss) per common share
|
$
|
0.72
|
($0.40
|
)
|
$
|
0.49
|
($0.01
|
)
|
($0.05
|
)
|
||||||
|
BALANCE
SHEET DATA:
|
||||||||||||||||
|
CASH
AND CASH EQUIVALENTS
|
$ |
21,558,739
|
$ |
12,279,646
|
$ |
989,252
|
$ |
1,984,636
|
$ |
167,547
|
||||||
|
TOTAL
ASSETS
|
71,691,670
|
44,122,318
|
30,176,711
|
20,882,097
|
9,821,226
|
|||||||||||
|
LONG-TERM
DEBT
|
7,337,105
|
3,487,757
|
831,156
|
815,418
|
-
|
|||||||||||
|
WORKING
CAPITAL ( Current Assets less
|
30,319,951
|
20,175,844
|
5,095,320
|
2,396,169
|
1,435,134
|
|||||||||||
|
Current
Liabilities)
|
||||||||||||||||
|
SHAREHOLDERS'
EQUITY
|
$ |
51,531,983
|
$ |
32,563,270
|
12,628,407
|
$ |
11,287,755
|
$ |
7,460,887
|
|||||||
|
|
·
|
For
the year ended April 30, 2007, the specialty communication systems
segment
represented approximately 81% of total revenue, and the wireless
infrastructure services segment represented approximately 19% of
total
revenue, which remains consistent with our historical services revenue
mix.
|
|
|
·
|
As
we continue to search for acquisitions, our primary goal is to identify
companies which are performing well financially and are compatible
with
the services that we perform in the specialty communication systems
segment. This trend could lead to a further shift in our revenue
composition towards the specialty communication systems segment.
We
believe that the strength of our experience in the design and
deployment of specialty communication systems gives us a competitive
advantage.
|
|
|
·
|
We
also seek to achieve organic growth in our existing business by maximizing
the value of our existing customer base, maintaining and expanding
our
focus in vertical markets and developing our relationships with technology
providers.
|
|
|
·
|
We
believe that the emergence of new and improved technologies such
as WiMAX
will create additional opportunities for us to design and deploy
solutions
through the use of the latest technologies and assisting existing
customers in enhancing the efficiency of their existing wireless
networks
using new technologies.
|
|
|
·
|
We
believe that the wireless carriers will continue to make expenditures
to
build and upgrade their networks, increase existing capacity, upgrade
their networks with new technologies and maintain their existing
infrastructure. In response to this trend, we will continue to provide
network deployment services that address wireless carrier
needs.
|
|
|
·
|
In
connection with the sale of our common stock and warrants to certain
investors during the third quarter ended January 31, 2005, we granted
certain registration rights that provided for liquidated damages
in the
event of failure to timely perform under the agreements. During the
third
quarter of fiscal 2006, we became aware that the SEC had recently
announced its preferred interpretation of the accounting for common
stock
and warrants with registration rights under Emerging Issues Task
Force
(EITF) 00-19, “Accounting for Derivative Financial Instruments Indexed To,
and Potentially Settled in the Company’s Own Stock,” and EITF 05-04, “The
Effect of a Liquidated Damages Clause on a Freestanding Financial
Instrument Subject to EITF 00-19.” Although the EITF was still reviewing
the guidance in EITF 05-04, the SEC concluded that under EITF 00-19,
the
common stock and warrants subject to registration rights where significant
liquidated damages could be required to be paid to the holder of
the
instrument in the event the issuer fails to maintain the effectiveness
of
a registration statement for a preset time period does not meet the
tests
required for shareholders’ equity classification and accordingly, must be
reflected as temporary equity in the balance sheet until the conditions
are eliminated. Additionally, the fair value of warrants should be
recorded as a liability, with an offsetting reduction to shareholders’
equity, adjusted to market value at the end of each period. In analyzing
instruments under EITF 00-19, the SEC concluded that the likelihood
or
probability related to the failure to maintain an effective registration
statement was not a factor at that time. During fiscal 2006, the
warrant
liability increased by $4,078,494, due to the increase in the market
value
of our common stock, resulting in a net non-cash loss on fair value
of
warrants for the fiscal year ended April 30, 2006. The non-cash loss
on
warrants had no effect on our cash flows or liquidity. On April 11,
2006,
we entered into a waiver agreement with the institutional investors
related to this private placement. Under the waiver, the parties
agreed to
modify the registration rights agreement associated with the common
stock
and warrants issued in November 2004 affected by EITF 00-19, thereby
eliminating the penalty provisions that could have resulted from
not
maintaining an effective registration statement related to these
common
shares and shares underlying the warrants, and eliminating any similar
non-cash charges in subsequent fiscal
years.
|
|
Year
Ended
|
|||||||||||||
|
April
30,
|
|||||||||||||
|
2007
|
2006
|
||||||||||||
|
REVENUE
|
$
|
70,000,070
|
100.0
|
%
|
$
|
52,144,575
|
100.0
|
%
|
|||||
|
COSTS
AND EXPENSES:
|
|||||||||||||
|
Cost
of revenue
|
47,781,351
|
68.3
|
%
|
38,010,945
|
72.9
|
%
|
|||||||
|
Selling,
general and administrative expenses
|
13,244,909
|
18.9
|
%
|
9,191,392
|
17.6
|
%
|
|||||||
|
Depreciation
and amortization
|
1,239,486
|
1.8
|
%
|
837,789
|
1.6
|
%
|
|||||||
|
Total
costs and expenses
|
62,265,746
|
89.0
|
%
|
48,040,126
|
92.1
|
%
|
|||||||
|
OPERATING
INCOME
|
7,734,324
|
11.0
|
%
|
4,104,449
|
7.9
|
%
|
|||||||
|
OTHER
EXPENSE (INCOME):
|
|||||||||||||
|
Interest
expense
|
496,330
|
0.7
|
%
|
256,022
|
0.5
|
%
|
|||||||
|
Interest
income
|
(525,524
|
)
|
(0.8
|
%)
|
(121,720
|
)
|
(0.2
|
%)
|
|||||
|
Minority
interest
|
23,099
|
0.0
|
%
|
-
|
0.0
|
%
|
|||||||
|
Loss
on change in fair value of warrants
|
-
|
0.0
|
%
|
4,078,494
|
7.8
|
%
|
|||||||
|
INCOME
(LOSS) BEFORE INCOME TAX PROVISION
|
7,740,419
|
11.1
|
%
|
(108,347
|
)
|
(0.2
|
%)
|
||||||
|
Income
tax provision
|
3,146,818
|
4.5
|
%
|
1,515,773
|
2.9
|
%
|
|||||||
|
NET
INCOME (LOSS)
|
$
|
4,593,601
|
6.6
|
%
|
($1,624,120
|
)
|
(3.1
|
%)
|
|||||
|
Year
Ended
|
|||||||||||||
|
April
30,
|
|||||||||||||
|
2006
|
2005
|
||||||||||||
|
REVENUE
|
$
|
52,144,575
|
100.0
|
%
|
$
|
40,148,233
|
100.0
|
%
|
|||||
|
COSTS
AND EXPENSES:
|
|||||||||||||
|
Cost
of revenue
|
38,010,945
|
72.9
|
%
|
32,445,470
|
80.8
|
%
|
|||||||
|
Selling,
general and administrative expenses
|
9,191,392
|
17.6
|
%
|
7,032,504
|
17.5
|
%
|
|||||||
|
Depreciation
and amortization
|
837,789
|
1.6
|
%
|
682,397
|
1.7
|
%
|
|||||||
|
Total
costs and expenses
|
48,040,126
|
92.1
|
%
|
40,160,371
|
100.0
|
%
|
|||||||
|
OPERATING
INCOME (LOSS)
|
4,104,449
|
7.9
|
%
|
(12,138
|
)
|
0.0
|
%
|
||||||
|
OTHER
EXPENSE (INCOME):
|
|||||||||||||
|
Interest
expense
|
256,022
|
0.5
|
%
|
31,865
|
0.1
|
%
|
|||||||
|
Interest
income
|
(121,720
|
)
|
(0.2
|
%)
|
(10,817
|
)
|
0.0
|
%
|
|||||
|
Loss
(gain) on change in fair value of warrants
|
4,078,494
|
7.8
|
%
|
(1,414,263
|
)
|
(3.5
|
%)
|
||||||
|
INCOME
(LOSS) BEFORE INCOME TAX PROVISION
|
(108,347
|
)
|
(0.2
|
%)
|
1,381,077
|
3.4
|
%
|
||||||
|
Income
tax provision
|
1,515,773
|
2.9
|
%
|
52,096
|
0.1
|
%
|
|||||||
|
NET
INCOME (LOSS)
|
($1,624,120
|
)
|
(3.1
|
%)
|
$
|
1,328,981
|
3.3
|
%
|
|||||
|
Less
than
|
1-2
|
3-5
|
More
than
|
|||||||||||||
|
Total
|
1
Year
|
Years
|
Years
|
5
Years
|
||||||||||||
|
Borrowings
under line of credit
|
$
|
4,454,217
|
$
|
-
|
$ |
-
|
$
|
4,454,217
|
$ |
-
|
||||||
|
Loans
payable
|
2,882,888
|
2,598,872
|
227,381
|
47,115
|
9,520
|
|||||||||||
|
Operating
leases
|
2,242,566
|
759,245
|
837,736
|
544,870
|
100,715
|
|||||||||||
|
Employment
agreements
|
5,494,583
|
2,612,800
|
2,881,783
|
-
|
-
|
|||||||||||
|
Total
obligations
|
$
|
15,074,254
|
$
|
5,970,917
|
$
|
3,946,900
|
$
|
5,046,202
|
$
|
110,235
|
||||||
|
Page
|
||||
|
Report
of Independent Registered Public Accounting Firm
|
F-2
|
|||
|
Consolidated
Balance Sheets as of April 30, 2007 and 2006
|
F-3
- F-4
|
|||
|
Consolidated
Statements of Operations for the years ended April
30, 2007, 2006 and 2005
|
F-5
|
|||
|
Consolidated
Statements of Shareholders' Equity for the years ended April 30,
2007,
2006 and 2005
|
F-6
- F-8
|
|||
|
Consolidated
Statements of Cash Flows for the years ended April
30, 2007, 2006 and 2005
|
F-9
- F-11
|
|||
|
Notes
to Consolidated Financial Statements
|
F-12
- F-31
|
|||
|
April
30,
|
April
30,
|
||||||
|
ASSETS
|
2007
|
2006
|
|||||
|
CURRENT
ASSETS:
|
|||||||
|
Cash
and cash equivalents
|
$
|
21,558,739
|
$
|
12,279,646
|
|||
|
Accounts
receivable, net of allowance of $98,786 and $104,786 at April 30,
2007 and
2006, respectively
|
16,560,636
|
12,141,789
|
|||||
|
Costs
and estimated earnings in excess of billings on uncompleted
contracts
|
2,499,940
|
1,441,977
|
|||||
|
Inventory
|
2,260,082
|
1,204,540
|
|||||
|
Prepaid
expenses and other current assets
|
732,043
|
286,625
|
|||||
|
Deferred
tax assets
|
54,000
|
78,000
|
|||||
|
Total
current assets
|
43,665,440
|
27,432,577
|
|||||
|
PROPERTY
AND EQUIPMENT, net
|
5,488,920
|
1,352,216
|
|||||
|
OTHER
INTANGIBLE ASSETS, net
|
1,683,349
|
864,388
|
|||||
|
GOODWILL
|
20,469,608
|
14,239,918
|
|||||
|
DEBT
ISSUANCE COSTS, net
|
10,000
|
111,091
|
|||||
|
DEFERRED
TAX ASSETS
|
111,000
|
51,000
|
|||||
|
OTHER
ASSETS
|
263,353
|
71,128
|
|||||
|
Total
assets
|
$
|
71,691,670
|
$
|
44,122,318
|
|||
|
April
30,
|
April
30,
|
||||||
|
LIABILITIES
AND SHAREHOLDERS' EQUITY
|
2007
|
2006
|
|||||
|
CURRENT
LIABILITIES:
|
|||||||
|
Current
portion of loans payable
|
$
|
2,598,872
|
$
|
231,065
|
|||
|
Accounts
payable and accrued expenses
|
6,802,110
|
4,989,861
|
|||||
|
Billings
in excess of costs and estimated earnings on uncompleted
contracts
|
2,272,688
|
1,085,312
|
|||||
|
Deferred
revenue
|
504,458
|
128,052
|
|||||
|
Due
to shareholders
|
707,000
|
381,377
|
|||||
|
Income
taxes payable
|
433,361
|
420,066
|
|||||
|
Deferred
tax liabilities
|
27,000
|
21,000
|
|||||
|
Total
current liabilities
|
13,345,489
|
7,256,733
|
|||||
|
Borrowings
under line of credit
|
4,454,217
|
3,000,000
|
|||||
|
Loans
payable, net of current portion
|
284,016
|
256,692
|
|||||
|
Due
to shareholders, net of current portion
|
-
|
514,623
|
|||||
|
Deferred
tax liabilities
|
722,000
|
531,000
|
|||||
|
Total
liabilities
|
18,805,722
|
11,559,048
|
|||||
|
Minority
interest in subsidiary
|
1,353,965
|
-
|
|||||
|
COMMITMENTS
AND CONTINGENCIES
|
|||||||
|
SHAREHOLDERS'
EQUITY:
|
|||||||
|
Preferred
stock - $0.0001 par value, 5,000,000 shares authorized, none
issued
|
-
|
-
|
|||||
|
Common
stock - $0.0001 par value, 75,000,000 shares authorized, 6,971,698
and
5,264,284 shares issued and outstanding at April 30, 2007 and 2006,
respectively
|
696
|
526
|
|||||
|
Additional
paid-in capital
|
47,901,160
|
33,525,130
|
|||||
|
Retained
earnings (accumulated deficit)
|
3,631,215
|
(962,386
|
)
|
||||
|
Accumulated
other comprehensive loss on translation of currency
exchange
|
(1,088
|
)
|
-
|
||||
|
Total
shareholders' equity
|
51,531,983
|
32,563,270
|
|||||
|
Total
liabilities and shareholders' equity
|
$
|
71,691,670
|
$
|
44,122,318
|
|||
|
Year
Ended
|
||||||||||
|
April
30,
|
||||||||||
|
2007
|
2006
|
2005
|
||||||||
|
REVENUE
|
$
|
70,000,070
|
$
|
52,144,575
|
$
|
40,148,233
|
||||
|
COSTS
AND EXPENSES:
|
||||||||||
|
Cost
of revenue
|
47,781,351
|
38,010,945
|
32,445,470
|
|||||||
|
Selling,
general and administrative expenses
|
13,244,909
|
9,191,392
|
7,032,504
|
|||||||
|
Depreciation
and amortization
|
1,239,486
|
837,789
|
682,397
|
|||||||
|
Total
costs and expenses
|
62,265,746
|
48,040,126
|
40,160,371
|
|||||||
|
OPERATING
INCOME (LOSS)
|
7,734,324
|
4,104,449
|
(12,138
|
)
|
||||||
|
OTHER
EXPENSE (INCOME):
|
||||||||||
|
Interest
expense
|
496,330
|
256,022
|
31,865
|
|||||||
|
Interest
income
|
(525,524
|
)
|
(121,720
|
)
|
(10,817
|
)
|
||||
|
Minority
interest
|
23,099
|
-
|
- | |||||||
|
Loss
(gain) on change in fair value of warrants
|
-
|
4,078,494
|
(1,414,263
|
)
|
||||||
|
INCOME
(LOSS) BEFORE INCOME TAX PROVISION
|
7,740,419
|
(108,347
|
)
|
1,381,077
|
||||||
|
Income
tax provision
|
3,146,818
|
1,515,773
|
52,096
|
|||||||
|
NET
INCOME (LOSS)
|
$
|
4,593,601
|
($1,624,120
|
)
|
$
|
1,328,981
|
||||
|
Basic
net income (loss) per common share
|
$
|
0.80
|
($0.40
|
)
|
$
|
0.50
|
||||
|
Diluted
net income (loss) per common share
|
$
|
0.72
|
($0.40
|
)
|
$
|
0.49
|
||||
|
Basic
weighted average number of common shares outstanding
|
5,772,423
|
4,057,940
|
2,679,529
|
|||||||
|
Diluted
weighted average number of common shares outstanding
|
6,409,333
|
4,057,940
|
2,729,866
|
|||||||
|
|
|
|
|
|
|
|
|
|
|
|
|
|
|
|
|
|
|
|
|
|
Retained
|
||||
|
Additional
|
Unearned
|
Earnings
|
Total
|
||||||||||||||||||||||
|
Preferred
Stock
|
Common
Stock
|
Paid-In
|
Consulting
|
(Accumulated
|
Shareholders' | ||||||||||||||||||||
|
|
|
|
Shares
|
|
|
Amount
|
|
|
Shares
|
|
|
Amount
|
|
|
Capital
|
Services
|
Deficit)
|
Equity
|
|||||||
|
BALANCE,
MAY 1, 2004
|
-
|
$
|
-
|
1,737,498
|
$
|
174
|
$
|
11,993,387
|
$
|
(38,559
|
)
|
($667,247
|
)
|
$
|
11,287,755
|
||||||||||
|
Common
stock issuance costs
|
-
|
-
|
-
|
-
|
(26,888
|
)
|
-
|
-
|
(26,888
|
)
|
|||||||||||||||
|
Amortization
of unearned consulting services
|
-
|
-
|
-
|
-
|
-
|
38,559
|
-
|
38,559
|
|||||||||||||||||
|
Net
income
|
-
|
-
|
-
|
-
|
-
|
-
|
1,328,981
|
1,328,981
|
|||||||||||||||||
|
BALANCE,
APRIL 30, 2005
|
-
|
-
|
1,737,498
|
174
|
11,966,499
|
-
|
661,734
|
12,628,407
|
|||||||||||||||||
|
|
|
|
|
|
|
|
|
|
|
|
|
|
|
|
Additional
|
|
|
|
|
|
Total
|
|
|
Preferred
Stock
|
Common
Stock
|
Paid-In
|
(Accumulated
|
Shareholders'
|
||||||||||||||||||
|
Shares
|
Amount
|
Shares
|
Amount
|
Capital
|
Deficit)
|
Equity
|
||||||||||||||||
|
Reclassification
of proceeds from sales of common stock
|
||||||||||||||||||||||
|
with
registration rights to additional paid-in capital
|
-
|
-
|
2,083,887
|
208
|
5,731,908
|
-
|
5,732,116
|
|||||||||||||||
|
Net
proceeds from exercise of warrants
|
-
|
-
|
554,717
|
55
|
4,167,092
|
-
|
4,167,147
|
|||||||||||||||
|
Reclassification
of fair value of warrant liability to additional
|
||||||||||||||||||||||
|
paid-in
capital from exercise of warrants
|
-
|
-
|
-
|
-
|
2,849,302
|
-
|
2,849,302
|
|||||||||||||||
|
Reclassification
of fair value of warrant liability to additional
|
||||||||||||||||||||||
|
paid-in
capital from the termination of liquidated
|
||||||||||||||||||||||
|
damages
provision under registration rights agreement
|
-
|
-
|
-
|
-
|
3,223,760
|
-
|
3,223,760
|
|||||||||||||||
|
Net
proceeds from issuance of common stock
|
-
|
-
|
876,931
|
88
|
5,528,078
|
-
|
5,528,166
|
|||||||||||||||
|
Net
proceeds from exercise of stock options
|
-
|
-
|
11,251
|
1
|
58,491
|
-
|
58,492
|
|||||||||||||||
|
Net
loss
|
-
|
-
|
-
|
-
|
-
|
(1,624,120
|
)
|
(1,624,120
|
)
|
|||||||||||||
|
BALANCE,
APRIL 30, 2006
|
-
|
-
|
5,264,284
|
526
|
33,525,130
|
(962,386
|
)
|
32,563,270
|
||||||||||||||
|
Accumulated
|
|||||||||||||||||||||||||
|
|
Other
|
||||||||||||||||||||||||
|
|
|
|
|
|
|
|
|
|
Additional
|
|
|
|
Compre-
|
Total
|
|||||||||||
|
Preferred
Stock
|
Common
Stock
|
Paid-In
|
Retained
|
hensive
|
Shareholders' | ||||||||||||||||||||
|
Shares
|
Amount
|
Shares
|
Amount
|
Capital
|
Earnings
|
|
Loss
|
Equity
|
|||||||||||||||||
|
Net
issuance of common stock, acquisition of
|
|||||||||||||||||||||||||
|
Southeastern
Communication Service, Inc.
|
-
|
-
|
200,288
|
20
|
1,349,631
|
- | - |
1,349,651
|
|||||||||||||||||
|
Net
issuance of common stock, acquisition of
|
|||||||||||||||||||||||||
|
Voacolo
Eletric Inc
|
113,534
|
11
|
1,249,869
|
- | - |
1,249,880
|
|||||||||||||||||||
|
Net
issuance of common stock, acquisition of
|
|||||||||||||||||||||||||
|
TAGS
|
61,277
|
6
|
719,864
|
- | - |
719,870
|
|||||||||||||||||||
|
Net
issuance of common stock
|
-
|
-
|
1,109,023
|
111
|
9,337,780
|
- | - |
9,337,891
|
|||||||||||||||||
|
Net
proceeds from exercise of warrants
|
-
|
-
|
30,281
|
3
|
197,873
|
- | - |
197,876
|
|||||||||||||||||
|
Fair
value of stock options granted to employees
|
-
|
-
|
-
|
-
|
37,526
|
- | - |
37,526
|
|||||||||||||||||
|
Net
proceeds from exercise of stock options
|
-
|
-
|
193,011
|
19
|
1,225,487
|
- | - |
1,225,506
|
|||||||||||||||||
|
Excess
tax benefit from exercise of stock options
|
- | - | - | - |
258,000
|
- | - |
258,000
|
|||||||||||||||||
|
Accumulated
other comprehensive loss
|
- | - | - | - |
-
|
- |
($1,088
|
) |
(1,088
|
) | |||||||||||||||
|
Net
income
|
-
|
-
|
-
|
-
|
-
|
$
|
4,593,601
|
- |
4,593,601
|
||||||||||||||||
|
BALANCE,
APRIL 30, 2007
|
-
|
$
|
-
|
6,971,698
|
$
|
696
|
$
|
47,901,160
|
$
|
3,631,215
|
($1,088
|
)
|
$
|
51,531,983
|
|||||||||||
|
Year
Ended
|
||||||||||
|
April
30,
|
||||||||||
|
2007
|
2006
|
2005
|
||||||||
|
OPERATING
ACTIVITIES:
|
||||||||||
|
Net
income (loss)
|
$
|
4,593,601
|
$
|
(1,624,120
|
)
|
$
|
1,328,981
|
|||
|
Adjustments
to reconcile net income (loss) to net cash provided by (used in)
operating
activities:
|
||||||||||
|
Depreciation
and amortization
|
1,239,486
|
837,789
|
682,397
|
|||||||
|
Fair
value of stock options granted to employees
|
37,526
|
-
|
-
|
|||||||
|
Change
in fair value of warrant liability
|
-
|
4,078,494
|
(1,414,263
|
)
|
||||||
|
(Recovery
of) provision for doubtful accounts
|
(6,000
|
)
|
29,000
|
14,007
|
||||||
|
Amortization
of debt issuance costs
|
111,091
|
47,696
|
-
|
|||||||
|
Amortization
of unearned consulting services
|
-
|
-
|
38,559
|
|||||||
|
Fair
value of stock options granted
|
-
|
-
|
||||||||
|
Excess
tax benefit from exercise of stock options
|
(258,000
|
)
|
-
|
-
|
||||||
|
Minority
interest
|
23,099
|
-
|
-
|
|||||||
|
Gain
on sale of fixed assets
|
(13,675
|
)
|
-
|
-
|
||||||
|
Deferred
income taxes
|
161,000
|
(43,000
|
)
|
(134,000
|
)
|
|||||
|
Changes
in operating assets and liabilities, net of effects of
acquisitions:
|
||||||||||
|
Accounts
receivable
|
2,320,439
|
(2,265,623
|
)
|
(1,898,625
|
)
|
|||||
|
Costs
and estimated earnings in excess of billings on uncompleted
contracts
|
(421,204
|
)
|
(533,022
|
)
|
1,214,076
|
|||||
|
Inventory
|
229,358
|
(318,916
|
)
|
(536,772
|
)
|
|||||
|
Prepaid
expenses and other current assets
|
89,273
|
249,706
|
(14,306
|
)
|
||||||
|
Other
assets
|
(180,187
|
)
|
37,001
|
(148,596
|
)
|
|||||
|
Accounts
payable and accrued expenses
|
(2,345,468
|
)
|
(376,943
|
)
|
(337,355
|
)
|
||||
|
Billings
in excess of costs and estimated earnings on uncompleted
contracts
|
329,544
|
8,873
|
(1,146,930
|
)
|
||||||
|
Deferred
revenue
|
222,092
|
-
|
-
|
|||||||
|
Income
taxes payable
|
37,244
|
381,758
|
(328,751
|
)
|
||||||
|
NET
CASH PROVIDED BY (USED IN) OPERATING ACTIVITIES
|
6,169,219
|
508,693
|
(2,681,578
|
)
|
||||||
|
INVESTING
ACTIVITIES:
|
||||||||||
|
Acquisition
of property and equipment, net
|
(673,237
|
) |
(234,792
|
) |
(215,844
|
) | ||||
|
Acquisition
of Quality, net of cash received
|
-
|
-
|
(6,708,904
|
) | ||||||
|
Acquisition
of Heinz, net of cash received
|
-
|
-
|
(82,283
|
) | ||||||
|
Acquisition
transaction costs
|
-
|
(4,304
|
) |
(17,553
|
) | |||||
|
Acquisition
of NECS, net of cash received
|
(4,607,268
|
) |
-
|
-
|
||||||
|
Acquisition
of SECS, net of cash received
|
(1,882,321
|
) |
-
|
-
|
||||||
|
Acquisition
of Voacolo, net of cash received
|
(627,694
|
) |
-
|
-
|
||||||
|
Acquisition
of TAGS, net of cash received
|
(841,252
|
) |
-
|
-
|
||||||
|
NET
CASH USED IN INVESTING ACTIVITIES
|
(8,631,772
|
) |
(239,096
|
) |
(7,024,584
|
) | ||||
|
FINANCING
ACTIVITIES:
|
||||||||||
|
Net
proceeds from exercise of warrants
|
197,876
|
4,167,147
|
-
|
|||||||
|
Net
proceeds from issuance of common stock
|
9,337,891
|
5,528,166
|
-
|
|||||||
|
Net
proceeds from exercise of stock options
|
1,225,506
|
58,492
|
-
|
|||||||
|
Net
proceeds from issuance of common stock with continuing registration
rights
|
-
|
-
|
9,140,949
|
|||||||
|
Excess
tax benefit from exercise of stock options
|
258,000
|
-
|
-
|
|||||||
|
Equity
issuance costs
|
(50,613
|
) |
-
|
(26,888
|
) | |||||
|
Debt
issuance costs
|
(10,000
|
) |
(158,787
|
) |
-
|
|||||
|
Borrowings
(repayments) under lines of credit, net
|
1,454,217
|
2,617,719
|
(303,848
|
) | ||||||
|
Repayments
of loans payable
|
(456,405
|
) |
(227,952
|
) |
(96,901
|
) | ||||
|
Payments
of amounts due to shareholders
|
(189,000
|
) |
(961,915
|
) |
-
|
|||||
|
Payments
of capital lease obligations
|
(24,738
|
) |
(2,073
|
) |
(2,534
|
) | ||||
|
NET
CASH PROVIDED BY FINANCING ACTIVITIES
|
11,742,734
|
11,020,797
|
8,710,778
|
|||||||
|
Effect
of exchange rate changes on cash
|
(1,088
|
) |
-
|
-
|
||||||
|
NET
INCREASE (DECREASE) IN CASH AND CASH EQUIVALENTS
|
9,279,093
|
11,290,394
|
(995,384
|
) | ||||||
|
CASH
AND CASH EQUIVALENTS, BEGINNING OF YEAR
|
12,279,646
|
989,252
|
1,984,636
|
|||||||
|
CASH
AND CASH EQUIVALENTS, END OF YEAR
|
$
|
21,558,739
|
$
|
12,279,646
|
$
|
989,252
|
||||
|
Year
Ended
|
|||||||||||||
|
April
30,
|
|||||||||||||
|
2007
|
2006
|
2005
|
|||||||||||
|
SUPPLEMENTAL
DISCLOSURE OF CASH FLOW INFORMATION:
|
|||||||||||||
|
Cash
paid during the period for:
|
|
||||||||||||
|
Interest
|
$
|
433,742
|
$
|
189,435
|
$
|
32,196
|
|||||||
|
Income
taxes
|
$
|
2,897,944
|
$
|
1,187,556
|
$
|
434,289
|
|||||||
|
SCHEDULE
OF NON CASH INVESTING AND FINANCING ACTIVITIES:
|
|||||||||||||
|
Issuance
of common stock for net non-cash assets received in acquisition
|
$
|
3,370,011
|
$
|
-
|
$
|
-
|
|||||||
|
Unpaid
purchase price adjustments related to acquisition
|
$
|
-
|
$
|
-
|
$
|
742,295
|
|||||||
|
Reversal
of accruals established in purchase accounting
|
$
|
-
|
$
|
2,150
|
$
|
40,022
|
|||||||
|
Issuance
of notes for property and equipment
|
$
|
74,382
|
$
|
266,834
|
$
|
192,210
|
|||||||
|
Reclassification
of proceeds from sales of common stock with registration
rights,
|
|||||||||||||
|
to
additional paid-in capital
|
$
|
-
|
$
|
5,732,116
|
$
|
-
|
|||||||
|
Reclassification
of fair value of warrant liability to additional paid-in capital
|
|||||||||||||
|
from
the exercise of warrants
|
$
|
-
|
$
|
2,849,302
|
$
|
-
|
|||||||
|
Reclassification
of fair value of warrant liability to additional paid-in capital
from
the
|
|||||||||||||
|
termination
of liquidated damages provision under registration rights
agreement
|
$
|
-
|
$
|
3,223,760
|
$
|
-
|
|||||||
|
Beginning
balance, May 1, 2005
|
$
|
13,961,642
|
||
|
Additional
transaction costs for prior acquisitions
|
2,675
|
|||
|
Clayborn
acquisition purchase price adjustment
|
48,803
|
|||
|
Quality
acquisition purchase price adjustment
|
226,798
|
|||
|
Ending
balance, April 30, 2006
|
14,239,918
|
|||
|
Additional
transaction costs for prior acquisitions
|
13,781
|
|||
|
NECS
acquisition
|
3,380,111
|
|||
|
SECS
acquisition
|
1,823,205
|
|||
|
Voacolo
acqusition
|
1,012,593
|
|||
|
Ending
balance, April 30, 2007
|
$
|
20,469,608
|
||
|
Estimated
useful life (years)
|
2007
|
2006
|
||||||||
|
Customer
lists
|
5
- 8
|
$
|
2,607,000
|
$
|
1,585,000
|
|||||
|
Contract
backlog
|
1-3
|
325,200
|
65,000
|
|||||||
|
2,932,200
|
1,650,000
|
|||||||||
|
Less
accumulated amortization expense
|
1,248,851
|
785,612
|
||||||||
|
$
|
1,683,349
|
$
|
864,388
|
|||||||
|
Year
ending April 30,
|
||||
|
2008
|
$
|
472,599
|
||
|
2009
|
352,665
|
|||
|
2010
|
301,831
|
|||
|
2011
|
195,353
|
|||
|
2012
|
138,965
|
|||
|
Thereafter
|
221,936
|
|||
|
Total
|
$
|
1,683,349
|
||
|
Risk-free
interest rate
|
4.73%
to 4.96%
|
|
Expected
volatility
|
61.0%
to 62.4%
|
|
Expected
dividend yield
|
0.0%
|
|
Expected
term ( in years)
|
3.5
|
|
2006
|
2005
|
||||||
|
Net
income (loss), as reported
|
($1,624,120
|
)
|
$
|
1,328,981
|
|||
|
Deduct
total stock-based employee compensation expense determined under
fair
value based method for all awards, net of tax
|
(453,092
|
)
|
(452,820
|
)
|
|||
|
Pro
forma net income (loss)
|
($2,077,212
|
)
|
$
|
876,161
|
|||
|
Basic
net income (loss) per share
|
|||||||
|
As
reported
|
($0.40
|
)
|
|
$0.50
|
|||
|
Pro
forma
|
($0.51
|
)
|
|
$0.33
|
|||
|
Diluted
net income (loss) per share
|
|||||||
|
As
reported
|
($0.40
|
)
|
|
$0.49
|
|||
|
Pro
forma
|
($0.51
|
)
|
|
$0.32
|
|||
|
Assets
purchased:
|
|
||||||
|
Cash
|
$
|
129,749
|
|||||
|
Accounts
receivable
|
968,982
|
||||||
|
Inventory
|
348,579
|
||||||
|
Prepaid
expenses
|
33,237
|
||||||
|
Fixed
assets
|
244,740
|
||||||
|
Other
assets
|
3,455
|
||||||
|
Customer
list
|
570,000
|
||||||
|
Goodwill
|
3,380,111
|
||||||
|
5,678,853
|
|||||||
|
Liabilities
assumed:
|
|||||||
|
Accounts
payable
|
(611,862
|
)
|
|||||
|
Accrued
expenses
|
(199,681
|
)
|
|||||
|
Deferred
revenue
|
(94,802
|
)
|
|||||
|
Capital
lease obligations
|
(24,738
|
)
|
|||||
|
Accrued
property taxes
|
(10,753
|
)
|
|||||
|
(941,836
|
)
|
||||||
|
Purchase
price
|
$
|
4,737,017
|
|||||
|
Assets
purchased:
|
|
||||||
|
Cash
|
$
|
200,012
|
|||||
|
Accounts
receivable
|
1,945,618
|
||||||
|
Inventory
|
97,096
|
||||||
|
Prepaid
expenses
|
54,186
|
||||||
|
Costs
in excess of billings
|
421,616
|
||||||
|
Fixed
assets
|
273,980
|
||||||
|
Other
assets
|
400
|
||||||
|
Backlog
|
60,000
|
||||||
|
Customer
list
|
320,000
|
||||||
|
Goodwill
|
1,823,205
|
||||||
|
5,196,113
|
|||||||
|
Liabilities
assumed:
|
|||||||
|
Accounts
payable
|
(727,612
|
)
|
|||||
|
Accrued
expenses
|
(323,497
|
)
|
|||||
|
Pension
plan payable
|
(75,000
|
)
|
|||||
|
Profit
sharing
|
(40,056
|
)
|
|||||
|
Notes
payable
|
(378,103
|
)
|
|||||
|
Billings
in excess of costs
|
(169,499
|
)
|
|||||
|
(1,713,767
|
)
|
||||||
|
Purchase
price
|
$
|
3,482,346
|
|
Assets
purchased:
|
||||
|
Cash
|
$
|
584,094
|
||
|
Accounts
receivable
|
2,119,362
|
|||
|
Inventory
|
217,500
|
|||
|
Prepaid
expenses
|
55,788
|
|||
|
Costs
in excess of billings
|
215,143
|
|||
|
Fixed
assets
|
217,899
|
|||
|
Backlog
|
200,200
|
|||
|
Customer
list
|
132,000
|
|||
|
Goodwill
|
1,012,593
|
|||
|
4,754,579
|
||||
|
Liabilities
assumed:
|
||||
|
Accounts
payable
|
(732,252
|
)
|
||
|
Accrued
expenses
|
(90,120
|
)
|
||
|
Payroll
and other payable
|
(80,672
|
)
|
||
|
Loan
payable
|
(602,984
|
)
|
||
|
Notes
payable
|
(100,436
|
)
|
||
|
Billings
in excess of costs
|
(686,327
|
)
|
||
|
|
(2,292,791
|
)
|
||
|
Purchase
price
|
$
|
2,461,788
|
||
|
Assets
purchased:
|
|
||||||
|
Cash
|
$
|
141,564
|
|||||
|
Accounts
receivable
|
1,699,320
|
||||||
|
Inventory
|
621,725
|
||||||
|
Other
current assets
|
399,664
|
||||||
|
Fixed
assets
|
3,415,035
|
||||||
|
6,277,308
|
|||||||
|
Liabilities
assumed:
|
|||||||
|
Accounts
payable
|
(72,710
|
)
|
|||||
|
Accrued
expenses and other payable
|
(714,126
|
)
|
|||||
|
Payroll
and other payable
|
(165,423
|
)
|
|||||
|
Dividends
payable
|
(312,724
|
)
|
|||||
|
Income
tax payable
|
(235,279
|
)
|
|||||
|
Notes
payable
|
(1,681,846
|
)
|
|||||
|
Deferred
Revenue
|
(61,519
|
)
|
|||||
|
Minority
Interest
|
(1,330,865
|
)
|
|||||
|
(4,574,492
|
)
|
||||||
|
Purchase
price
|
$
|
1,702,816
|
|||||
|
|
Consolidated
Pro Forma
|
|||||||||
|
2007
|
2006
|
2005
|
||||||||
|
Revenues
|
$
|
81,176,137
|
$
|
76,551,105
|
$
|
68,248,366
|
||||
|
Net
income (loss)
|
5,167,349
|
(567,876
|
)
|
2,071,474
|
||||||
|
Basic
weighted shares
|
5,983,074
|
4,439,847
|
3,061,436
|
|||||||
|
Diluted
weighted shares
|
6,620,059
|
4,439,847
|
3,111,774
|
|||||||
|
Basic
net income (loss) per share
|
|
$0.86
|
($0.13
|
)
|
|
$0.68
|
||||
|
Diluted
net income (loss) per share
|
|
$0.78
|
($0.13
|
)
|
|
$0.67
|
||||
|
2007
|
2006
|
||||||
|
Costs
incurred on uncompleted contracts
|
$
|
39,431,006
|
$
|
24,694,056
|
|||
|
Estimated
contract profit
|
12,513,277
|
6,593,218
|
|||||
|
51,944,283
|
31,287,274
|
||||||
|
Less:
billings to date
|
51,717,031
|
30,930,609
|
|||||
|
Net
excess of costs
|
$
|
227,252
|
$
|
356,665
|
|||
|
Costs
and estimated earnings in excess of billings
|
$
|
2,499,940
|
$
|
1,441,977
|
|||
|
Billings
in excess of costs and estimated earnings
|
|||||||
|
on
uncompleted contracts
|
(2,272,688
|
)
|
(1,085,312
|
)
|
|||
|
Net
excess of costs
|
$
|
227,252
|
$
|
356,665
|
|||
|
Estimated
useful life (years)
|
2007
|
2006
|
||||||||
|
Furniture
and fixtures
|
5
- 7
|
$
|
222,963
|
$
|
135,383
|
|||||
|
Computers
and software
|
2-3
|
722,072
|
476,342
|
|||||||
|
Office
equipment
|
5-7
|
92,337
|
55,612
|
|||||||
|
Vehicles
|
5
- 7
|
1,903,142
|
1,256,568
|
|||||||
|
Machinery
and equipment
|
5
|
4,231,918
|
393,436
|
|||||||
|
Leasehold
improvements
|
2-3
|
436,477
|
227,774
|
|||||||
|
7,608,909
|
2,545,115
|
|||||||||
|
Less
accumulated depreciation and amortization expense
|
2,119,989
|
1,192,899
|
||||||||
|
$
|
5,488,920
|
$
|
1,352,216
|
|||||||
|
Year
ending April 30,
|
|
||||||
|
2008
|
$
|
2,598,872
|
|||||
|
2009
|
128,850
|
||||||
|
2010
|
4,552,748
|
||||||
|
2011
|
28,207
|
||||||
|
2012
|
18,909
|
||||||
|
Thereafter
|
|
9,519
|
|||||
|
Total
long-term debt
|
$
|
7,337,105
|
|||||
|
2007
|
2006
|
2005
|
||||||||
|
Current
|
||||||||||
|
Federal
|
$
|
2,201,000
|
$
|
1,248,000
|
$
|
99,000
|
||||
|
State
and foreign
|
784,818
|
310,773
|
87,096
|
|||||||
|
Deferred
|
||||||||||
|
Federal
|
147,000
|
(70,000
|
)
|
(76,000
|
)
|
|||||
|
State
|
14,000
|
27,000
|
(58,000
|
)
|
||||||
|
Totals
|
$
|
3,146,818
|
$
|
1,515,773
|
$
|
52,096
|
||||
|
2007
|
2006
|
2005
|
||||||||
|
Expected
tax (benefit) provision at statutory rate (34%)
|
$
|
2,631,742
|
$
|
(36,838
|
)
|
$
|
469,566
|
|||
|
State
and local taxes, net of federal tax benefit
|
527,675
|
205,530
|
19,000
|
|||||||
|
Foreign
income taxes
|
30,117
|
-
|
-
|
|||||||
|
Loss
(gain) on fair value of warrants
|
-
|
1,386,688
|
(481,566
|
)
|
||||||
|
Other
|
(42,716
|
)
|
(39,607
|
) |
45,096
|
|||||
|
Totals
|
$
|
3,146,818
|
$
|
1,515,773
|
$
|
52,096
|
||||
|
2007
|
2006
|
||||||
|
Deferred
tax assets:
|
|||||||
|
Allowance
for doubtful accounts
|
$
|
27,000
|
$
|
33,000
|
|||
|
Reserve
for loss on work-in-progress
|
-
|
31,000
|
|||||
|
Net
operating loss carryforward
|
16,000
|
-
|
|||||
|
Federal
benefit of deferred state tax liabilities
|
11,000
|
14,000
|
|||||
|
Deferred
tax assets-current
|
54,000
|
78,000
|
|||||
|
Customer
lists
|
111,000
|
51,000
|
|||||
|
Net
operating loss carryforward
|
154,000
|
83,000
|
|||||
|
Valuation
allowance
|
(154,000
|
)
|
(83,000
|
)
|
|||
|
Deferred
tax assets-long term
|
111,000
|
51,000
|
|||||
|
Deferred
tax liabilities:
|
|||||||
|
Inventory
|
(14,000
|
)
|
(13,000
|
)
|
|||
|
Federal
benefit of deferred state tax liabilities
|
(13,000
|
)
|
(8,000
|
)
|
|||
|
Deferred
tax liabilities-current
|
(27,000
|
)
|
(21,000
|
)
|
|||
|
Fixed
assets
|
(107,000
|
)
|
(126,000
|
)
|
|||
|
Customer
lists
|
(90,000
|
)
|
(175,000
|
)
|
|||
|
Goodwill
|
(525,000
|
)
|
(230,000
|
)
|
|||
|
Deferred
tax liabilities-long term
|
(722,000
|
)
|
(531,000
|
)
|
|||
|
Net
deferred tax liabilities
|
$
|
(584,000
|
)
|
$
|
(423,000
|
)
|
|
2002
Stock Option Plan
|
2006
Stock Option Plan
|
||||||||||||
|
Number
of Shares
|
Weighted-average
Exercise Price
|
Number
of Shares
|
Weighted-average
Exercise Price
|
||||||||||
|
Outstanding,
May 1, 2004
|
299,322
|
12.49
|
- | - | |||||||||
|
Granted
|
266,890
|
6.15
|
- | - | |||||||||
|
Cancelled
|
(111,585
|
)
|
6.58
|
||||||||||
|
Outstanding,
May 1, 2005
|
454,627
|
8.77
|
-
|
-
|
|||||||||
|
Granted
|
18,730
|
6.94
|
383,500
|
6.16
|
|||||||||
|
Cancelled
|
(59,174
|
)
|
14.96
|
-
|
-
|
||||||||
|
Exercised
|
(11,251
|
)
|
5.22
|
-
|
-
|
||||||||
|
Outstanding,
May 1, 2006
|
402,932
|
7.87
|
383,500
|
6.16
|
|||||||||
|
Granted
|
- | - |
11,252
|
8.01
|
|||||||||
|
Cancelled
|
(42,589
|
)
|
6.46
|
(1,250
|
)
|
6.15
|
|||||||
|
Exercised
|
(126,768
|
)
|
9.00
|
(66,243
|
)
|
7.22
|
|||||||
|
Outstanding,
May 1, 2007
|
233,575
|
8.43
|
327,259
|
6.22
|
|||||||||
|
Options
Outstanding at April 30, 2007
|
Options
Exercisable at April 30, 2007
|
|||||||||||||||
|
Exercise
prices
|
Shares
under option
|
Weighted-average
remaining life in years
|
Weighted-average
Exercise Price
|
Shares
under option
|
Weighted-average
Exercise Price
|
|||||||||||
|
$4.80
- $5.52
|
40,593
|
2.73
|
$
|
5.11
|
39,009
|
$
|
5.10
|
|||||||||
|
$6.10
- $9.00
|
451,000
|
3.17
|
$
|
6.48
|
429,700
|
$
|
6.42
|
|||||||||
|
$10.92-$14.40
|
62,823
|
1.35
|
$
|
12.13
|
62,823
|
$
|
12.13
|
|||||||||
|
$16.20-$19.92
|
6,418
|
0.74
|
$
|
17.41
|
6,418
|
$
|
17.41
|
|||||||||
|
Total
|
560,834
|
2.91
|
$
|
7.14
|
537,950
|
$
|
7.13
|
|||||||||
|
2002
Plan
|
2006
Plan
|
||||||||||||||||||||||||
|
Number
of Shares
|
Weighted-average
Exercise Price
|
Weighted-
average Remaining Contractual Term
|
Aggregate
Intrinsic Value
|
Number
of Shares
|
Weighted-average
Exercise Price
|
Weighted-average
Remaining Contractual Term
|
Aggregate
Intrinsic Value
|
||||||||||||||||||
|
Outstanding,
May 1, 2006
|
402,932
|
$
|
7.87
|
383,500
|
$
|
6.16
|
- | - | |||||||||||||||||
|
|
|||||||||||||||||||||||||
|
Granted
|
-
|
-
|
- | - |
11,252
|
$
|
8.01
|
- | - | ||||||||||||||||
|
Exercised
|
(126,768
|
) |
$
|
6.46
|
- | - |
(66,243
|
) |
$
|
6.15
|
- | - | |||||||||||||
|
Forfeited/Expired
|
(42,589
|
) |
$
|
9.00
|
- | - |
(1,250
|
) |
$
|
7.22
|
-
|
- | |||||||||||||
|
Outstanding,
April 30, 2007
|
233,575
|
$
|
8.43
|
2.1
|
$
|
1,200,630
|
327,259
|
$
|
6.22
|
3.5
|
$
|
2,366,810
|
|||||||||||||
|
|
|||||||||||||||||||||||||
|
Vested
and expected to vested, April 30, 2007
|
232,580
|
$
|
8.44
|
2.1
|
$
|
1,194,301
|
325,533
|
$
|
6.21
|
3.5
|
$
|
2,357,062
|
|||||||||||||
|
|
|||||||||||||||||||||||||
|
Exercisable,
April 30, 2007
|
223,360
|
$
|
8.50
|
2.0
|
$
|
1,134,453
|
314,590
|
$
|
6.15
|
3.5
|
$
|
2,296,929
|
|||||||||||||
|
Number
of Shares
|
Weighted
Average Exercise Price
|
||||||
|
Outstanding,
May 1, 2004
|
425,784
|
$
|
10.57
|
||||
|
Granted
|
2,146,387
|
8.40
|
|||||
|
Outstanding,
May 1, 2005
|
2,572,171
|
8.76
|
|||||
|
Granted
|
-
|
-
|
|||||
|
Exercised
|
(554,717
|
)
|
8.40
|
||||
|
Outstanding,
May 1, 2006
|
2,017,454
|
8.62
|
|||||
|
Granted
|
320,741
|
6.99
|
|||||
|
Exercised
|
(30,281
|
)
|
6.99
|
||||
|
Expired
|
(424,118
|
)
|
10.57
|
||||
|
Outstanding,
April 30, 2007
|
1,883,796
|
$
|
6.99
|
||||
|
As
of and for year ended April 30, 2007
|
|||||||||||||
|
Corporate
|
Wireless
Infrastructure
|
Specialty
Communication
|
Total
|
||||||||||
|
Revenue
|
$
|
-
|
$
|
13,250,499
|
$
|
56,749,571
|
$
|
70,000,070
|
|||||
|
Depreciation
and amortization
|
$
|
57,368
|
$
|
259,097
|
$
|
923,021
|
$
|
1,239,486
|
|||||
|
Income
(loss) before income taxes
|
$ |
(1,851,995
|
)
|
$
|
976,769
|
$
|
8,615,645
|
$
|
7,740,419
|
||||
|
Goodwill
|
$
|
-
|
$
|
4,319,071
|
$
|
16,150,537
|
$
|
20,469,608
|
|||||
|
Total
assets
|
$
|
10,419,087
|
$
|
10,878,557
|
$
|
50,394,026
|
$
|
71,691,670
|
|||||
|
As
of and for year ended April 30, 2006
|
|||||||||||||
|
Corporate
|
Wireless
Infrastructure
|
Specialty
Communication
|
Total
|
||||||||||
|
Revenue
|
$
|
-
|
$
|
9,300,228
|
$
|
42,844,347
|
$
|
52,144,575
|
|||||
|
Depreciation
and amortization
|
$
|
59,474
|
$
|
103,264
|
$
|
675,051
|
$
|
837,789
|
|||||
|
Income
(loss) before income taxes
|
$ |
(5,615,080
|
)
|
$
|
1,240,928
|
$
|
4,265,805
|
$ |
(108,347
|
)
|
|||
|
Goodwill
|
$
|
-
|
$
|
2,482,085
|
$
|
11,757,833
|
$
|
14,239,918
|
|||||
|
Total
assets
|
$
|
10,627,658
|
$
|
6,531,651
|
$
|
26,963,009
|
$
|
44,122,318
|
|||||
|
As
of and for year ended April 30, 2005
|
|||||||||||||
|
Corporate
|
Wireless
Infrastructure
|
Specialty
Communication
|
Total
|
||||||||||
|
Revenue
|
$
|
-
|
$
|
8,651,555
|
$
|
31,496,678
|
$
|
40,148,233
|
|||||
|
Depreciation
and amortization
|
$
|
20,423
|
$
|
161,485
|
$
|
500,489
|
$
|
682,397
|
|||||
|
Income
(loss) before income taxes
|
$
|
207,777
|
$
|
783,014
|
$
|
390,286
|
$
|
1,381,077
|
|||||
|
Goodwill
|
$
|
-
|
$
|
2,479,410
|
$
|
11,482,232
|
$
|
13,961,642
|
|||||
|
Total
assets
|
$
|
1,169,887
|
$
|
4,604,335
|
$
|
24,402,489
|
$
|
30,176,711
|
|||||
|
Year
Ended April 30, 2007
|
1Q07
|
2Q07
|
3Q07
|
4Q07
|
|||||||||
|
Revenue
|
$
|
16,436,278
|
$
|
17,753,044
|
$
|
18,121,405
|
$
|
17,689,343
|
|||||
|
Operating
income
|
1,414,839
|
1,815,102
|
2,122,564
|
2,381,819
|
|||||||||
|
Net
income
|
$
|
914,427
|
$
|
1,064,647
|
$
|
1,251,879
|
$
|
1,362,648
|
|||||
|
Basic
net income per common share
|
$
|
0.17
|
$
|
0.19
|
$
|
0.23
|
$
|
0.20
|
|||||
|
Diluted
net income per common share
|
$
|
0.16
|
$
|
0.18
|
$
|
0.20
|
$
|
0.18
|
|||||
|
Year
Ended April 30, 2006
|
1Q06
|
2Q06
|
3Q06
|
4Q06
|
|||||||||
|
Revenue
|
$
|
12,171,639
|
$
|
14,250,243
|
$
|
11,821,189
|
$
|
13,901,504
|
|||||
|
Operating
income
|
563,378
|
1,345,837
|
1,140,776
|
1,054,455
|
|||||||||
|
Loss
(gain) on change in fair value of warrants
|
4,110,594
|
(2,382,912
|
)
|
9,678,732
|
(7,327,920
|
)
|
|||||||
|
Net
income ( loss)
|
($3,795,319
|
)
|
$
|
3,167,717
|
($9,012,290
|
)
|
$
|
8,015,769
|
|||||
|
Basic
net income (loss) per common share
|
($0.99
|
)
|
$
|
0.82
|
($2.26
|
)
|
$
|
1.75
|
|||||
|
Diluted
net income (loss) per common share
|
($0.99
|
)
|
$
|
0.82
|
($2.26
|
)
|
$
|
1.62
|
|||||
|
Year
ending April 30,
|
||||
|
2008
|
$
|
759,245
|
||
|
2009
|
469,068
|
|||
|
2010
|
368,668
|
|||
|
2011
|
251,706
|
|||
|
2012
|
192,449
|
|||
|
Thereafter
|
201,430
|
|||
|
Total
minimum lease payments
|
$
|
2,242,566
|
||
|
NAME
|
AGE
|
OFFICES
HELD
|
||
|
Andrew
Hidalgo
|
51
|
Chairman,
Chief Executive Officer and Director
|
||
|
Joseph
Heater
|
43
|
Chief
Financial Officer
|
||
|
Donald
Walker
|
44
|
Executive
Vice President
|
||
|
James
Heinz
|
47
|
Executive
Vice President
|
||
|
Richard
Schubiger
|
42
|
Executive
Vice President
|
||
|
Charles
Madenford
|
44
|
Executive
Vice President
|
||
|
Norm
Dumbroff
|
46
|
Director
|
||
|
Neil
Hebenton
|
51
|
Director
|
||
|
Gary
Walker
|
52
|
President
of Walker Comm, Inc and Director
|
||
|
William
Whitehead
|
51
|
Director
|
|
Name
and Principal Position
|
Year
|
Salary
($)
|
Bonus
($)
|
All
Other Compensation ($)
|
Total
($)
|
|
|
Andrew
Hidalgo
|
2007
|
168,000
|
60,000
|
10,800
(7)
|
|
238,800
|
|
Chairman,
Chief Executive Officer
|
2006
|
168,000
|
-
|
11,492
(7)
|
|
179,492
|
|
and
Director (1)
|
2005
|
168,000
|
-
|
9,549
(7)
|
|
177,549
|
|
|
|
|
||||
|
Joseph
Heater
|
2007
|
140,000
|
40,000
|
-
|
180,000
|
|
|
Chief
Financial Officer (2)
|
2006
|
139,333
|
-
|
-
|
139,333
|
|
|
2005
|
132,000
|
-
|
-
|
132,000
|
||
|
|
|
|||||
|
Donald
Walker
|
2007
|
145,000
|
131,448
|
13,200
(8)
|
|
289,648
|
|
Executive
Vice President (3)
|
2006
|
140,000
|
37,215
|
-
|
177,215
|
|
|
2005
|
140,000
|
10,269
|
-
|
150,269
|
||
|
|
|
-
|
||||
|
Gary
Walker
|
2007
|
142,500
|
131,448
|
12,190
(8)
|
|
286,138
|
|
President-
Walker and Director (4)
|
2006
|
140,000
|
37,215
|
-
|
177,215
|
|
|
2005
|
140,000
|
10,269
|
-
|
150,269
|
||
|
|
|
|||||
|
Richard
Schubiger
|
2007
|
140,000
|
107,829
|
-
|
247,829
|
|
|
Executive
Vice President (5)
|
2006
|
140,000
|
73,658
|
-
|
213,658
|
|
|
2005
|
50,000
|
-
|
-
|
50,000
|
||
|
|
|
|||||
|
James
Heinz
|
2007
|
141,667
|
33,577
|
-
|
175,244
|
|
|
Executive
Vice President (6)
|
2006
|
140,005
|
31,985
|
-
|
171,990
|
|
|
2005
|
140,000
|
-
|
-
|
140,000
|
|
Name
|
Number
of Securities underlying Unexercised Options (#)
Exercisable
|
Number
of Securities underlying Unexercised Options (#)
Unexercisable
|
Option
Exercise Price ($/Sh)
|
Option
Expiration Date
|
|||||||||
|
Andrew
Hidalgo
|
73,046
|
-
|
$
|
6.60
|
10/6/2009
|
||||||||
|
126,690
|
-
|
$
|
6.14
|
10/13/2010
|
|||||||||
|
|
|||||||||||||
|
Joseph
Heater
|
20,834
|
-
|
$
|
9.00
|
6/12/2008
|
||||||||
|
12,500
|
-
|
$
|
12.84
|
8/6/2008
|
|||||||||
|
7,500
|
-
|
$
|
6.60
|
10/6/2009
|
|||||||||
|
63,345
|
-
|
$
|
6.14
|
10/13/2010
|
|||||||||
|
|
|||||||||||||
|
James
Heinz
|
10,000
|
-
|
$
|
5.25
|
2/1/2010
|
||||||||
|
38,007
|
-
|
$
|
6.14
|
10/13/2010
|
|||||||||
|
Richard
Schubiger
|
10,000
|
-
|
$
|
5.25
|
2/1/2010
|
||||||||
|
38,007
|
-
|
$
|
6.14
|
10/13/2010
|
|||||||||
|
Option
Awards
|
|||||||
|
Name
|
Number
of Shares Acquired on Exercise
|
Value
Realized Upon Exercise ($)
|
|||||
|
Andrew
Hidalgo
|
81,121
|
305,662
|
|||||
|
Joseph
Heater
|
27,500
|
120,833
|
|||||
|
Donald
Walker
|
38,007
|
157,181
|
|||||
|
Gary
Walker
|
19,820
|
10,136
|
|||||
|
Name
|
Option
Awards
($)(*)
|
Total
($)
|
|||||
|
JeNorm
Dumbroff (1)
|
8,762
|
8,762
|
|||||
|
Neil
Hebenton (2)
|
8,762
|
8,762
|
|||||
|
William
Whitehead (3)
|
8,762
|
8,762
|
|||||
|
Total:
|
26,286
|
26,286
|
|||||
|
*
|
Amounts
represent the aggregate grant date fair value of stock-based compensation
expense for stock options granted in fiscal 2007 under SFAS 123R as
discussed in Note 2, "Summary of Significant Accounting Policies” of
the Notes to Consolidated Financial Statements included elsewhere
in this
Annual Report on Form 10-K.
|
|
(1)
|
23,988
options were outstanding as of April 30, 2007, of which 21,904 were
exercisable as of April 30, 2007.
|
|
(2)
|
13,988
options were outstanding as of April 30, 2007, of which 11,904 were
exercisable as of April 30, 2007.
|
|
(3)
|
23,988
options were outstanding as of April 30, 2007, of which 21,904 were
exercisable as of April 30, 2007.
|
|
•
|
by
each person who is known by us to beneficially own more than 5% of
our
common stock;
|
|
•
|
by
each of our officers and directors;
and
|
|
•
|
by
all of our officers and directors as a
group.
|
|
Number
of
|
Percentage
|
|||||||||
|
Name
And Address Of Beneficial Owner (1)
|
Shares
Owned (2)
|
of
Class (3)
|
||||||||
|
Andrew
Hidalgo
|
403,953
|
(4)
|
|
5.63
|
%
|
|||||
|
Joseph
Heater
|
104,179
|
(4)
|
|
1.47
|
%
|
|||||
|
Donald
Walker
|
- |
-
|
||||||||
|
James
Heinz
|
107,531
|
(4)
|
|
1.53
|
%
|
|||||
|
Richard
Schubiger
|
48,007
|
(4)
|
|
*
|
||||||
|
Charles
Madenford
|
4,084 |
(4)
|
* | |||||||
|
Norm
Dumbroff
|
94,822
|
(4)
|
|
1.36
|
%
|
|||||
|
Neil
Hebenton
|
13,988
|
(4)
|
|
*
|
||||||
|
Gary
Walker
|
66,280
|
(4)
|
|
*
|
||||||
|
William
Whitehead
|
30,155
|
(4)
|
|
*
|
||||||
|
All
Officers and Directors as a Group (10 persons)
|
872,999
|
(4)
|
|
11.73
|
%
|
|||||
|
|
||||||||||
|
Special
Situations Private Equity Fund, L.P.
|
1,045,466
|
(5)
|
|
13.95
|
%
|
|||||
|
153
E. 53rd Street, 55th Floor
|
|
|||||||||
|
New
York, NY 10022
|
||||||||||
|
Special
Situations Fund III QP, L.P.
|
1,442,666
|
(5)
|
|
18.88
|
%
|
|||||
|
527
Madison Avenue, Suite 2600
|
||||||||||
|
New
York, NY 10022
|
||||||||||
|
SF
Capital Partners Ltd.
|
500,360
|
(6)
|
|
6.93
|
%
|
|||||
| 3600 South Lake Dr. | ||||||||||
| St. Francis, WI 53235 | ||||||||||
|
Plan
Category
|
(a)
Number
of securities to be issued upon exercise of outstanding options,
warrants
and rights
|
(b)
Weighted-average
exercise price of outstanding options, warrants and rights
|
(c)
Number
of securities remaining available for future issuance under equity
compensation plans excluding securities reflected in column (a)
(1)
|
|||||||
|
Equity
compensation plan approved by board of directors (1)
|
233,575
|
$
|
8.43
|
45,073
|
||||||
|
Equity
compensation plan approved by security holders (2)
|
327,259
|
$
|
6.22
|
6,498
|
||||||
|
Equity
compensation plan approved by security holders (3)
|
-
|
-
|
400,000
|
|||||||
|
Total
|
560,834
|
$
|
7.14
|
451,571
|
||||||
|
(1)
|
We
established a nonqualified stock option plan pursuant to which options
to
acquire a maximum of 416,667 shares of our common stock were reserved
for
grant (the 2002 Plan). As of April 30, 2007, included above in the
2002
Plan are 204,096 shares issuable upon exercise of options granted
to
employees and directors, and 29,334 options granted to outside consultants
for services rendered to our
company.
|
|
(2)
|
We
established the 2006 Incentive Stock Plan, under which 400,000 shares
of
common stock were reserved for issuance upon the exercise of stock
options, stock awards or restricted stock. As of April 30, 2007,
383,500
shares were issuable upon exercise of options granted to employees
and
directors.
|
|
(3)
|
We
established the 2007 Incentive Stock Plan, under which 400,000 shares
of
common stock were reserved for issuance upon the exercise of stock
options, stock awards or restricted stock. As of April 30, 2007,
400,000
shares were issuable upon exercise of options granted to employees
and
directors.
|
|
3.1
|
Certificate
of Incorporation, as amended, incorporated by reference to Exhibit
3.1 of
WPCS International Incorporated’s registration statement on Form SB-2,
filed April 7, 2006.
|
|
3.2
|
Amended
and Restated Bylaws, incorporated by reference to Exhibit 3.2 of
WPCS
International Incorporated’s registration statement on Form SB-2, filed
April 7, 2006.
|
|
4.1
|
Certificate
of Designation of Series A Convertible Preferred Stock, incorporated
by
reference to Exhibit 4.1 of wowtown.com, Inc.’s Form SB-2, filed June 8,
2000.
|
|
4.2
|
Certificate
of Designation of Series B Convertible Preferred Stock, incorporated
by
reference to Exhibit 4.2 of WPCS International Incorporated’s Annual
Report on Form 10-KSB, filed July 29,
2002.
|
|
4.3
|
Certificate
of Designation of Series C Convertible Preferred Stock, incorporated
by
reference to Exhibit 4.3 of WPCS International Incorporated’s Annual
Report on Form 10-KSB, filed August 14,
2003.
|
|
4.4
|
2002
Employee Stock Option Plan, incorporated by reference to Exhibit
4.4 of
WPCS International Incorporated’s Annual Report on Form 10-KSB, filed
August 14, 2003.
|
|
4.5
|
Form
of 2003 Common Stock Purchase Warrant, incorporated by reference
to
Exhibit 4.5 of WPCS International Incorporated’s Annual Report on Form
10-KSB, filed August 14, 2003.
|
|
4.6
|
2006
Incentive Stock Plan, incorporated by reference to Exhibit 4.2 of
WPCS
International Incorporated’s registration statement on Form S-8, filed
September 21, 2005.
|
|
4.7
|
2007
Incentive Stock Plan, incorporated by reference to Exhibit A of WPCS
International Incorporated’s definitive proxy statement on Schedule 14A,
filed August 18, 2006.
|
|
10.1
|
Employment
Agreement by and between WPCS International Incorporated and Andrew
Hidalgo, dated as of February 1, 2004, incorporated by reference
to
Exhibit 10.1 of WPCS International Incorporated’s registration statement
on Form SB-2/A, filed April 30,
2004.
|
|
10.2
|
Employment
Agreement by and among WPCS International Incorporated, Walker Comm,
Inc,
and Donald Walker, incorporated by reference to Exhibit 10.3 of WPCS
International Incorporated’s Annual Report on Form 10-KSB, filed August
14, 2003.
|
|
10.3
|
Employment
Agreement by and among WPCS International Incorporated, Walker Comm,
Inc,
and Gary Walker, incorporated by reference to Exhibit 10.4 of WPCS
International Incorporated’s Annual Report on Form 10-KSB, filed August
14, 2003.
|
|
10.4
|
Employment
Agreement by and between WPCS International Incorporated and Joseph
Heater, dated as of June 1, 2005, incorporated by reference to Exhibit
10.4 of WPCS International Incorporated’s Annual Report on Form 10-KSB,
filed July 29, 2005.
|
|
10.5
|
Employment
Agreement by and between Heinz Corporation and James Heinz, dated
as of
April 1, 2004, incorporated by reference to Exhibit 10.12 of WPCS
International Incorporated’s registration statement on Form SB-2/A, filed
April 30, 2004.
|
|
10.6
|
Employment
Agreement by and between Quality Communications & Alarm Company, Inc.
and Richard Schubiger, dated as of August 1, 2005, incorporated by
reference to Exhibit 10.6 of WPCS International Incorporated’s
registration statement on Form SB-2, filed February 8,
2006.
|
|
10.7
|
Agreement
and Plan of Merger by and among Phoenix Star Ventures, Inc., WPCS
Acquisition Corp., a Delaware corporation, WPCS Holdings, Inc., a
Delaware
corporation, and Andy Hidalgo, dated as of May 17, 2002, incorporated
by
reference to Exhibit 1 of WPCS International Incorporated’s Current Report
on Form 8-K/A, filed June 12,
2002.
|
|
10.8
|
Agreement
and Plan of Merger by and among WPCS International Incorporated,
Invisinet
Acquisitions Inc., Invisinet, Inc., J. Johnson LLC and E. J. von
Schaumburg made as of the 13th day of November, 2002, incorporated
by
reference to Exhibit 3 of WPCS International Incorporated’s Current Report
on Form 8-K, filed November 27,
2002.
|
|
10.9
|
Amendment
to Invisinet Bonus Agreement, dated as of May 27, 2003, incorporated
by
reference to Exhibit 10.8 of WPCS International Incorporated’s Annual
Report on Form 10-KSB, filed August 14,
2003.
|
|
10.10
|
Agreement
and Plan of Merger by and among WPCS International Incorporated,
Walker
Comm Merger Corp., Walker Comm, Inc., Donald C. Walker, Gary R. Walker,
and Tanya D. Sanchez made as of the 30th day of December, 2002,
incorporated by reference to Exhibit 10.10 of WPCS International
Incorporated’s registration statement on Form SB-2, filed February 8,
2006.
|
|
10.11
|
Agreement
and Plan of Merger by and among WPCS International Incorporated,
Clayborn
Contracting Acquisition Corp., Clayborn Contracting Group, Inc.,
David G.
Gove and Sharon Gove made as of the 22nd day of August, 2003, incorporated
by reference to Exhibit 3 of WPCS International Incorporated’s Current
Report on Form 8-K, filed August 29,
2003.
|
|
10.12
|
Agreement
and Plan of Merger by and among WPCS International Incorporated,
Heinz
Acquisition Corp., Heinz Corporation and James Heinz made as of the
2nd
day of April, 2004, incorporated by reference to Exhibit 3 of WPCS
International Incorporated’s Current Report on Form 8-K, filed April 9,
2004.
|
|
10.13
|
Stock
Purchase Agreement by and among WPCS International Incorporated and
Richard Schubiger, Matthew Haber and Brian Fortier, dated as of November
24, 2004, incorporated by reference to Exhibit 10.1 of WPCS International
Incorporated’s current report on Form 8-K, filed November 30,
2004.
|
|
10.14
|
Form
of Securities Purchase Agreement, dated as of November 16, 2004,
incorporated by reference to Exhibit 10.1 of WPCS International
Incorporated’s current report on Form 8-K, filed November 19,
2004.
|
|
10.15
|
Form
of Common Stock Purchase Warrant, dated as of November 16, 2004,
incorporated by reference to Exhibit 10.2 of WPCS International
Incorporated’s current report on Form 8-K, filed November 19,
2004.
|
|
10.16
|
Form
of Registration Rights Agreement, dated as of November 16, 2004,
incorporated by reference to Exhibit 10.3 of WPCS International
Incorporated’s current report on Form 8-K, filed November 19,
2004.
|
|
10.17
|
Purchase
Agreement, dated as of April 11, 2006, incorporated by reference
to
Exhibit 10.1 of WPCS International Incorporated’s current report on Form
8-K, filed April 12, 2006.
|
|
10.18
|
Waiver,
dated as of April 11, 2006, incorporated by reference to Exhibit
10.2 of
WPCS International Incorporated’s current report on Form 8-K, filed April
12, 2006.
|
|
10.19
|
Stock
Purchase Agreement, dated as of June 7, 2006, by and among WPCS
International Incorporated, New England Communications Systems, Inc.,
Myron Polulak, Carolyn Windesheim and Gary Tallmon, incorporated
by
reference to Exhibit 10.1 of WPCS International Incorporated’s current
report on Form 8-K, filed June 9,
2006.
|
|
|
|
10.20
|
Employment
Agreement, dated as of June 7, 2006, between New England Communications
Systems, Inc. and Myron Polulak, incorporated by reference to Exhibit
10.2
of WPCS International Incorporated’s current report on Form 8-K, filed
June 9, 2006.
|
|
|
|
10.21
|
Employment
Agreement, dated as of June 7, 2006, between New England Communications
Systems, Inc. and Carolyn Windesheim, incorporated by reference to
Exhibit
10.3 of WPCS International Incorporated’s current report on Form 8-K,
filed June 9, 2006.
|
|
10.22
|
Stock
Purchase Agreement, dated as of July 19, 2006, by and among WPCS
International Incorporated, Southeastern Communication Service, Inc.,
Daniel G. Lester, Christopher P. Lester, Thomas A. Lester, Michael
D.
Lester, Karl F. Eickmeyer and Anthony Ankersmit, incorporated by
reference
to Exhibit 10.1 of WPCS International Incorporated’s current report on
Form 8-K, filed July 20, 2006.
|
|
|
|
10.23
|
Registration
Rights Agreement, dated as of July 19, 2006, by and among WPCS
International Incorporated, Southeastern Communication Service, Inc.,
Daniel G. Lester, Christopher P. Lester, Thomas A. Lester, Michael
D.
Lester, Karl F.Eickmeyer
and Anthony Ankersmit, incorporated by reference to Exhibit 10.2
of WPCS
International Incorporated’s current report on Form 8-K, filed July 20,
2006.
|
|
10.24
|
Form
of Securities Purchase Agreement, dated as of January 30, 2007,
incorporated by reference to Exhibit 10.1 of WPCS International
Incorporated’s current report on Form 8-K, filed February 1,
2007.
|
|
10.25
|
Form
of Registration Rights Agreement, dated as of January 30, 2007,
incorporated by reference to Exhibit 10.2 of WPCS International
Incorporated’s current report on Form 8-K, filed February 1,
2007
|
|
10.26
|
Stock
Purchase Agreement, dated as of March 30, 2007, by and among WPCS
International Incorporated, Voacolo Electric Incorporated, Jeffrey
Voacolo, David Voacolo, Joseph Voacolo and Tracy Hossler, incorporated
by
reference to Exhibit 10.1 of WPCS International Incorporated’s current
report on Form 8-K, filed April 2,
2007.
|
|
|
|
10.27
|
Registration
Rights Agreement, dated as of March 30, 2007, by and among WPCS
International Incorporated, Voacolo Electric Incorporated, Jeffrey
Voacolo, David Voacolo, Joseph Voacolo and Tracy Hossler, incorporated
by
reference to Exhibit 10.2 of WPCS International Incorporated’s current
report on Form 8-K, filed April 2,
2007.
|
|
|
|
10.28
|
Employment
Agreement, dated as of March 30, 2007, between Voacolo Electric
Incorporated and Jeffrey Voacolo, incorporated by reference to Exhibit
10.4 of WPCS International Incorporated’s current report on Form 8-K,
filed April 2, 2007.
|
|
10.29
|
Employment
Agreement, dated as of March 30, 2007, between Voacolo Electric
Incorporated and David Voacolo, incorporated by reference to Exhibit
10.5
of WPCS International Incorporated’s current report on Form 8-K, filed
April 2, 2007.
|
|
10.30
|
Employment
Agreement, dated as of March 30, 2007, between Voacolo Electric
Incorporated and Joseph Voacolo, incorporated by reference to Exhibit
10.6
of WPCS International Incorporated’s current report on Form 8-K, filed
April 2, 2007.
|
|
10.31
|
Interest
Purchase Agreement, dated as of April 5, 2007, by and among WPCS
International Incorporated, American Gas Services, Inc. and American
Gas
Services, Inc. Consultants, incorporated by reference to Exhibit
10.1 of
WPCS International Incorporated’s current report on Form 8-K, filed April
9, 2007.
|
|
10.32
|
Loan
Agreement, dated April 10, 1007, by and among WPCS International
Incorporated, Bank of America, N.A. Clayborn Contracting Group, Inc.,
Heinz Corporation, New England Communications Systems, Inc., Quality
Communications & Alarm Company., Inc., Southeastern Communication
Service, Inc., and Walker Comm,
incorporated by reference to Exhibit 10.1 of WPCS International
Incorporated’s amended current report on Form 8-K/A, filed April 17,
2007.
|
|
10.33
|
Security
Agreement, dated April 10, 1007, by and among WPCS International
Incorporated, Bank of America, N.A. Clayborn Contracting Group, Inc.,
Heinz Corporation, New England Communications Systems, Inc., Quality
Communications & Alarm Company., Inc., Southeastern Communication
Service, Inc., and Walker Comm, Inc.,
incorporated by reference to Exhibit 10.2 of WPCS International
Incorporated’s amended current report on Form 8-K/A, filed April 17,
2007.
|
|
10.34
|
Non-binding
letter of intent setting forth the agreement and understanding as
to the
terms of the acquisition of Major electric, Inc, dated June 14, 2007,
filed herewith.
|
|
10.35
|
Non-binding
letter of intent setting forth the agreement and understanding as
to the
terms of the acquisition of Max Engineering LLC, dated June 25, 2007,
filed herewith.
|
|
10.36
|
Employment
Agreement, effective as of April 1, 2007, between WPCS International
Incorporated and Charles Madenford, filed
herewith.
|
|
14
|
Code
of Ethics and Business Conduct, incorporated by reference to Exhibit
14 of
WPCS International Incorporated’s annual report on Form 10-KSB, filed
August 14, 2003.
|
|
21.1
|
Subsidiaries
of the registrant, filed herewith.
|
|
23.1
|
Consent
of J.H. Cohn LLP, Independent Registered Public Accounting
Firm.
|
|
31.1
|
Certification
of Chief Executive Officer pursuant to Rule 13a-14 and Rule 15d-14(a),
promulgated under the Securities and Exchange Act of 1934, as
amended
|
|
31.2
|
Certification
of Chief Financial Officer pursuant to Rule 13a-14 and Rule 15d 14(a),
promulgated under the Securities and Exchange Act of 1934, as
amended
|
|
32.1
|
Certification
pursuant to 18 U.S.C. Section 1350, as adopted pursuant to Section
906 of
the Sarbanes-Oxley Act of 2002 (Chief Executive
Officer)
|
|
32.2
|
Certification
pursuant to 18 U.S.C. Section 1350, as adopted pursuant to Section
906 of
the Sarbanes-Oxley Act of 2002 (Chief Financial
Officer)
|
|
(A)
Description
|
(B)
Balance
at
Beginning of Period
|
(C)
Additions Charged to Costs and Expenses
|
(D)
Deductions
|
(E)
Balance
at
end of Period
|
||||||||||||
|
Allowance
for
Doubtful Accounts
|
||||||||||||||||
|
April
30, 2005
|
$
|
61,779
|
$
|
17,037
|
($3,030
|
)
|
(1)
|
|
$
|
75,786
|
||||||
|
April
30, 2006
|
75,786
|
35,877
|
(6,877
|
)
|
(1)
|
|
104,786
|
|||||||||
|
April
30, 2007
|
$
|
104,786
|
-
|
|
($6,000
|
)
|
(1)
|
|
$
|
98,786
|
| WPCS INTERNATIONAL INCORPORATED | ||
| |
|
|
| Date: July 30, 2007 | By: | /s/ ANDREW HIDALGO |
|
Andrew
Hidalgo
|
||
|
Chief
Executive Officer (Principal Executive
Officer)
|
||
| |
|
|
| Date: July 30, 2007 | By: | /s/ JOSEPH HEATER |
|
Joseph
Heater
|
||
|
Chief
Financial Officer (Principal Accounting
Officer)
|
||
|
Name
|
Position
|
Date
|
|||||
|
/s/
ANDREW HIDALGO
Andrew
Hidalgo
|
Chairman
of the Board
|
July
30, 2007
|
|||||
|
|
|||||||
|
/s/
NORM DUMBROFF
Norm Dumbroff |
Director
|
July
30, 2007
|
|||||
|
/s/
NEIL HEBENTON
Neil
Hebenton
|
Director
|
July
30, 2007
|
|||||
|
/s/
GARY WALKER
Gary Walker |
Director
|
July
30, 2007
|
|||||
|
/s/
WILLIAM WHITEHEAD
William
Whitehead
|
Director
|
July
30, 2007
|
|||||